Data
The challenge involves dataset from following six countries in the form of road images including damaged parts: India, Japan, Czech Republic, Norway, United States, and China. The damage information is provided as the coordinates of the bounding box and a label depicting the type of damage associated with the box. Following article may be referred for sample images and annotations available from India, Japan, and Czech Republic:
Arya,D., Maeda,H., Ghosh,S.K., Toshniwal D., & Sekimoto, Y.(2021). RDD2020: An annotated image dataset for automatic road damage detection using deep learning. Data in brief, 36, 107133. <https://doi.org/10.1016/j.dib.2021.107133>.
The data from other three countries has been contributed by the winners of Phase I of the challenge.
The dataset is divided into two parts: Training and Test. The Training set is provided with annotations; however, the test set is purely to test the models and will be released without annotations. The dataset can be accessed at the website (https://github.com/sekilab/RoadDamageDetector) . The approximate number of images is presented in the table below. Though the data includes annotations for multiple categories, only the following four categories are considered for CRDDC'2022: D00 (Longitudinal Crack), D10 (Transverse Crack), D20 (Alligator Crack), and D40 (Potholes) . The corresponding label map is provided on the GitHub website along with RDD2022 data. Please refer to the articles GRDDC'2020_Preprint_Open Access and RDD2020_article for details.
| Country | Training images | Test images |
|---|---|---|
| India | 9000 | 1000 |
| Japan | 10000 | 1000 |
| Czech Republic | 2000 | 1000 |
| Norway | 9000 | 1000 |
| United States | 5000 | 1000 |
| China | 3500 | 1000 |
It may be noted that, the data from newly added countries Norway and United States follows the format for RDD2020 data (road images are captured parallely to the road surface using vehicle mounted cameras). For China, data captured at a different angle (top-down/oblique images captured using drones/handheld Smartphone) than other countries is utilized. The purpose of adding this data is to improve the heterogenity of the dataset. The users may decide whether to use the dataset as a whole or skip the top-down images while training the model. The data article providing further details of the dataset will be released soon.
Update (22/09/2022) - The article provididng details of the data released through CRDDC'2022 can be accessed here! Please cite if you are using the data or the information.
Update (29/10/2022) - The RDD2022 data released through CRDDC is now also available on FigShare Repository! Kindly cite if you are using the data or the information.
Evaluation
The datasets contributed by the participants have been evaluated considering several factors. The factors declared during Phase I submissions are listed below.
- Dataset size (the larger the size, the better it is).
- Data collection mechanism: The feasibility of including the general public to collect data and low resource requirements would be preferred. In exceptional cases, the data collected using specialized vehicles can also be considered based on the quality of data and the information provided in the report.
- Annotation procedure: Annotations prepared using open source software or a mechanism that can be replicated with minimal efforts in the future, following some standard guidelines should be preferred.
- Type of road considered: Since the theme is Crowd-sourcing based damage detection, the type of road pavement, Asphalt or Cemented, would be finalized based on the amount of data received from participants.
- Annotation type: Similar to the type of road pavement, the type of annotation (object-based or pixel-based) would be finalized based on the amount of data received. New tasks may be added if enough data is received for both types.
- Heterogeneity covered: The challenge is based on Global Road Damage Detection; the more the heterogeneity – spatial/temporal…., the better it is.
- Data collection conditions: Data collected with real/natural conditions would be preferred over those collected/prepared under artificial conditions (such as controlled illumination conditions).
- Nature of Data (Natural/Artificial): Natural data would be preferred. However, synthetic data would also be considered based on the technique used, correctness, and amount of data prepared.
- Data availability: Participants contributing the dataset which is not already available in public domain shall be ranked higher.
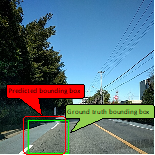
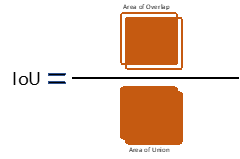
The results of the model proposed by the participants are evaluated by "F-Measure." The prediction is considered to be correct only when IoU (Intersection over Union, see Fig.1) is 0.5 or more, and the predicted label and the ground truth label match. Dividing the area of overlap by the area of union yields intersection over union (Fig.2). The average evaluation result for the multiple-leaderboards will be measured, and the team providing the highest score will win the competition.